Aimsio is rolling out an updated interface across the web app in phases. Depending on your account, you may see the new interface on some pages and the old interface on others. This migration is staged over time, with different pages updated over several releases. When it’s complete, every page will be on the new interface.
This update has been in development for more than a year, and we’re rolling it out carefully, one account at a time, so your team’s work isn’t interrupted.
This article covers what’s new, where to find it, and what to expect while the rollout continues.
What’s New at a Glance
-
More control on every table: Hide columns, filter what you need, pin columns in place, and refresh for the latest data.
-
Calculated columns: Build your own formulas on any page, without exporting to a spreadsheet.
-
Pivot tables and row grouping: Group rows by client, job, or crew and total values like dollars or hours directly in the table.
-
A new report center: Reports that used to live under the Dashboard now have their own page, with more controls.
-
Additional benefits: Faster performance and more options to save preferences on your reports.
More Control Across Page Tables
These controls are available on all operational pages, including Tickets, Timesheets, Purchase Orders, and more.
Columns and filters
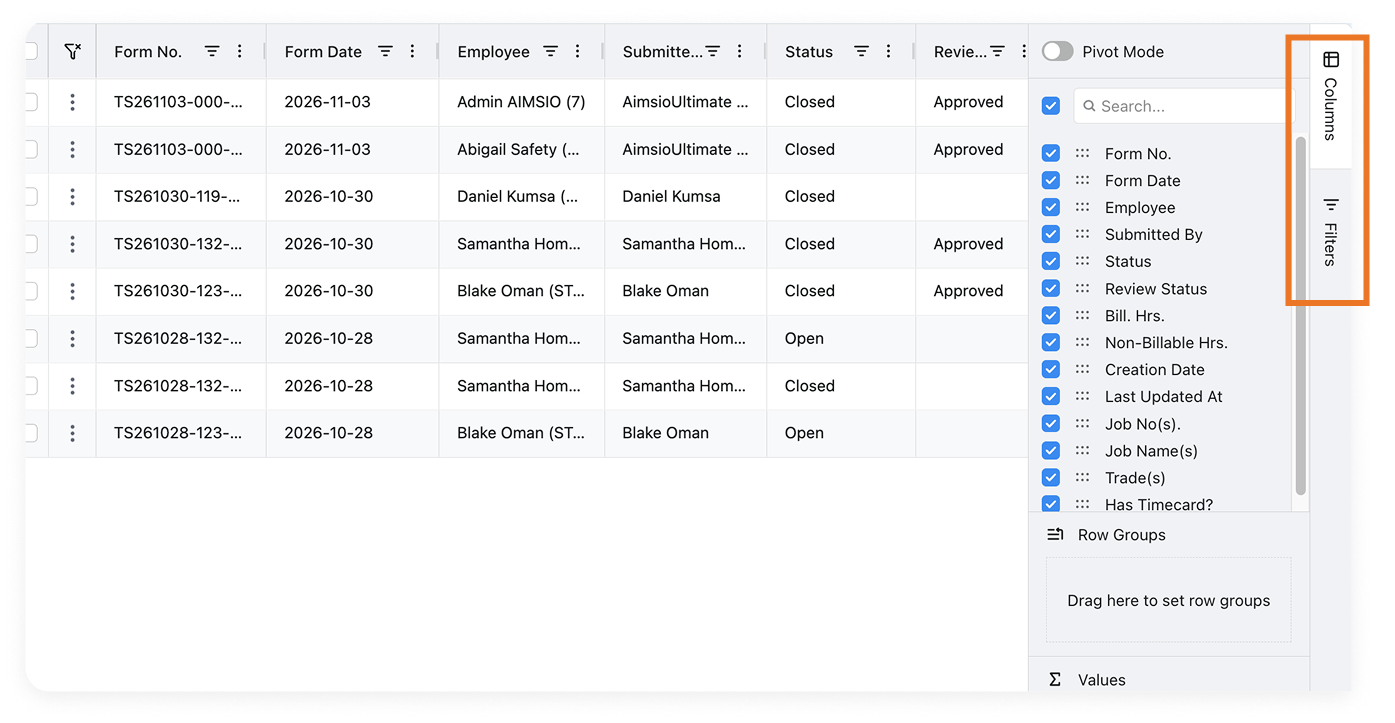
Your controls are on the right side of the table.
-
Columns: Open the Columns tab to show or hide any field. Check, uncheck, and drag to reorder.
-
Filters: Click the filter icon on any column header to filter right there, or open the Filters tab to set several filters at once.
Pin columns
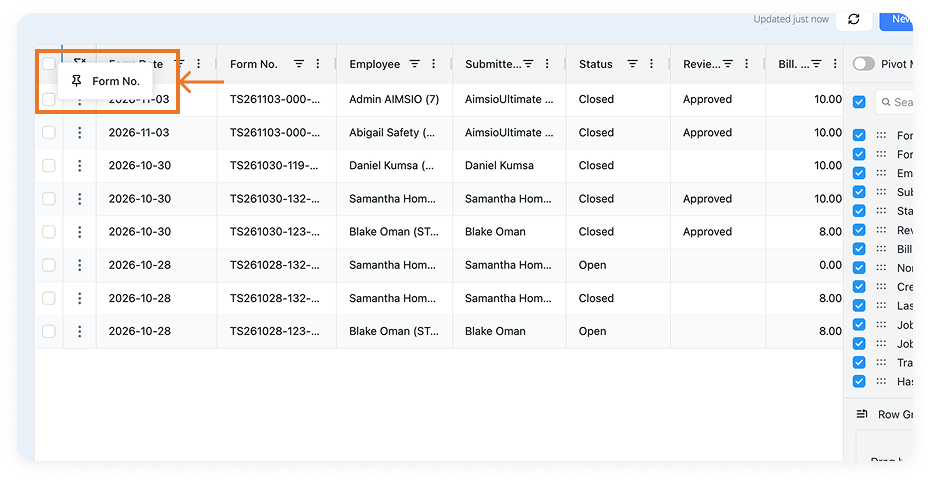
Scrolling a wide table? Drag any column header all the way to the left to pin it in place. Useful for keeping Form no. or Ticket # visible as you scroll right.
Refresh
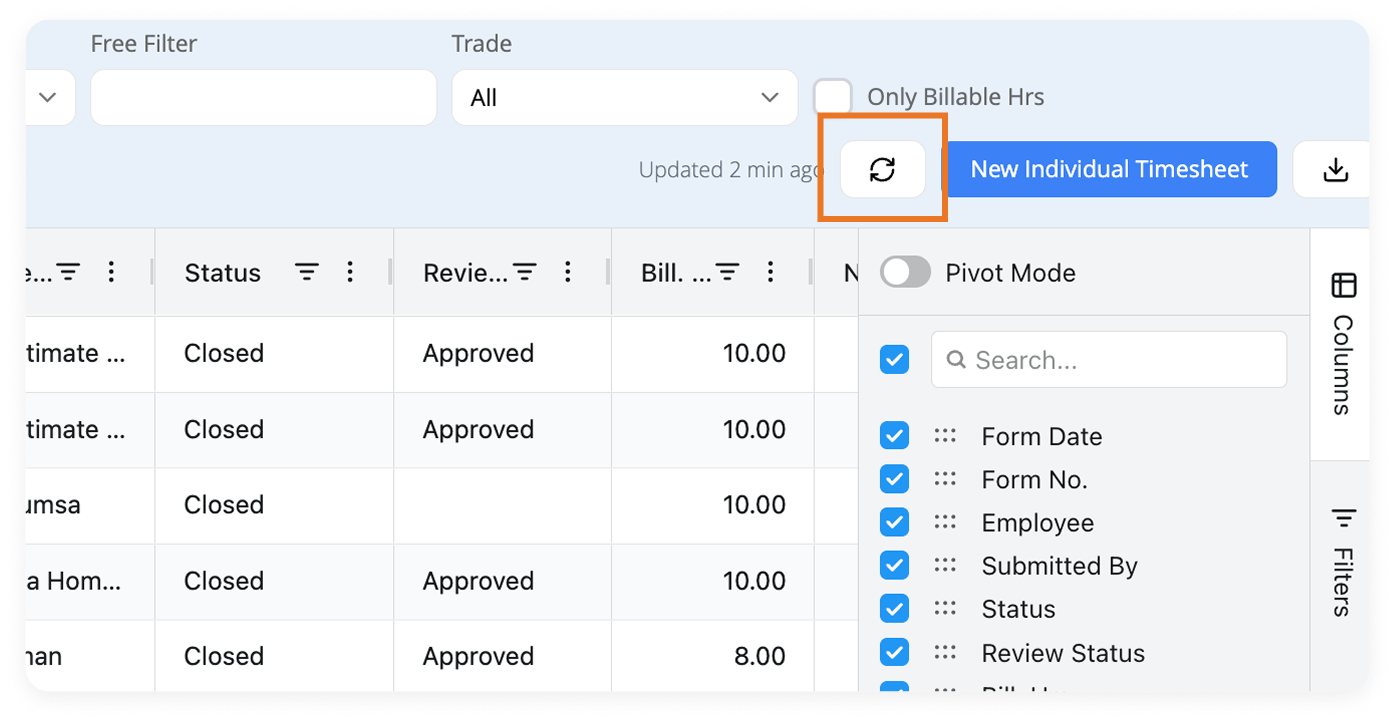
Hit the refresh button in the top right to pull in the latest activity.
Build Formulas with Calculated Columns
Need a number that isn’t in the table? Build it. Calculated columns work on every page, so you don’t need to export to a spreadsheet to do the math.
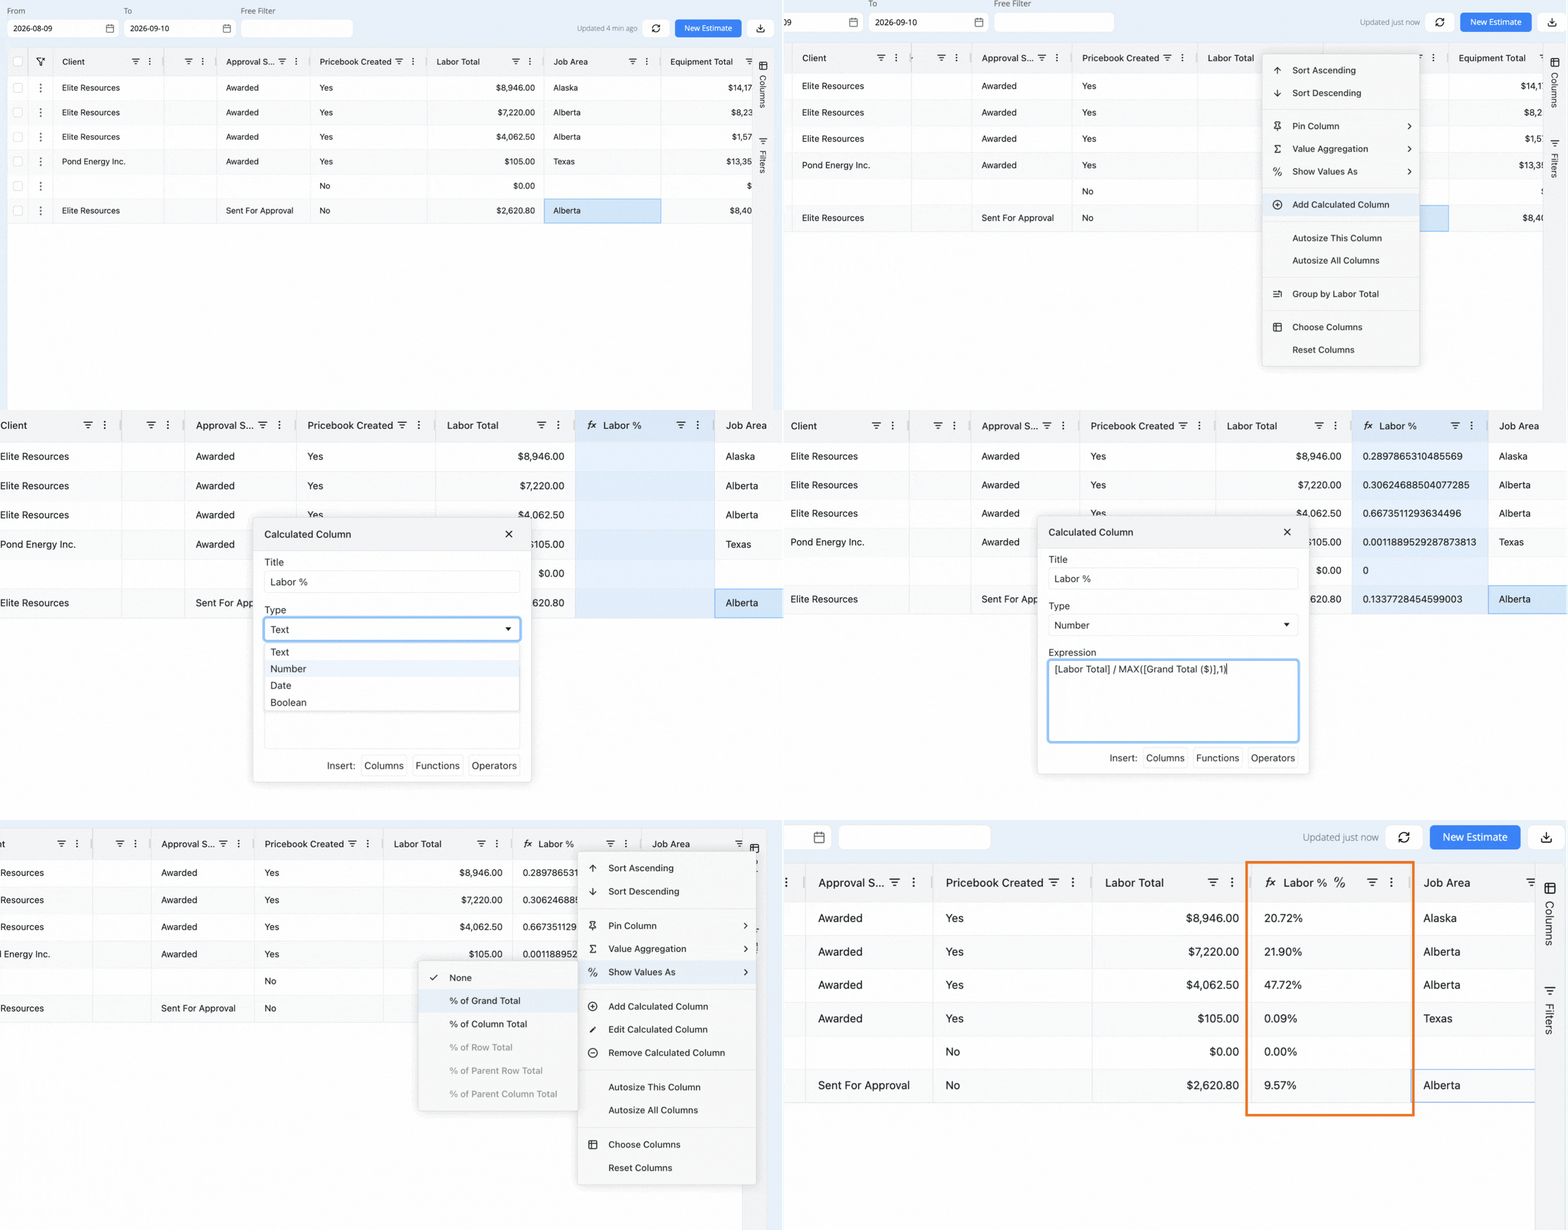
How to add a calculated column:
-
Click the three-dot menu on any column header.
-
Select Add Calculated Column to open the formula builder.
-
Type your formula, or use the Columns, Functions, and Operators buttons to add fields for you.
-
Apply it, and the new column appears in your table.
You can edit or remove a calculated column later from the same menu.
Pivot Tables and Row Groupings
On all updated pages except Tickets, you also have access to Pivot Mode, Row Groups, and Values inside the Columns panel.
Row Groups and Values
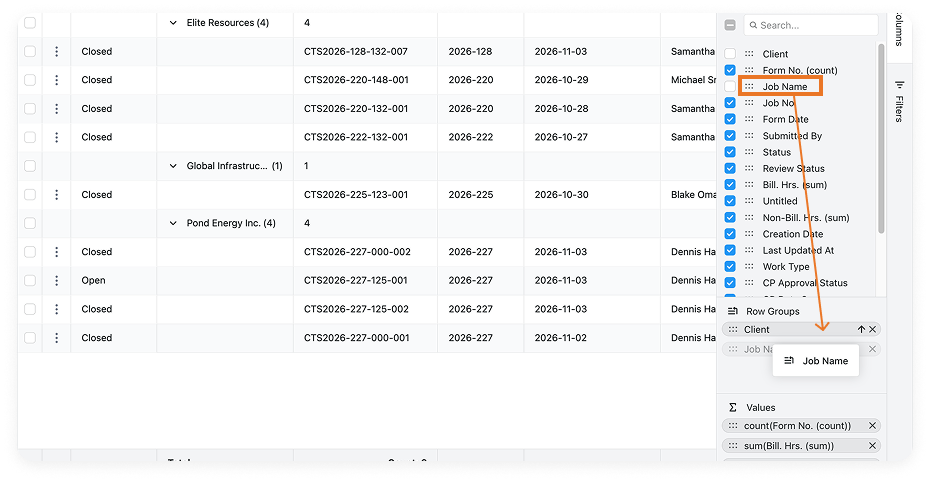
Drag any field into Row Groups to organize your data, for example, by client, job, crew member, or date. Values total your numbers automatically for each group.
-
Click the Columns tab on the right side of the table.
-
In the panel, find Row Groups and drag a column into it, such as Client.
-
Check the Values section. It can total fields like Bill Hrs and Non-Bill Hrs for each group. Add or remove fields here to change what gets totalled.
-
Expand or collapse a group to see the records behind a total.
Pivot Mode
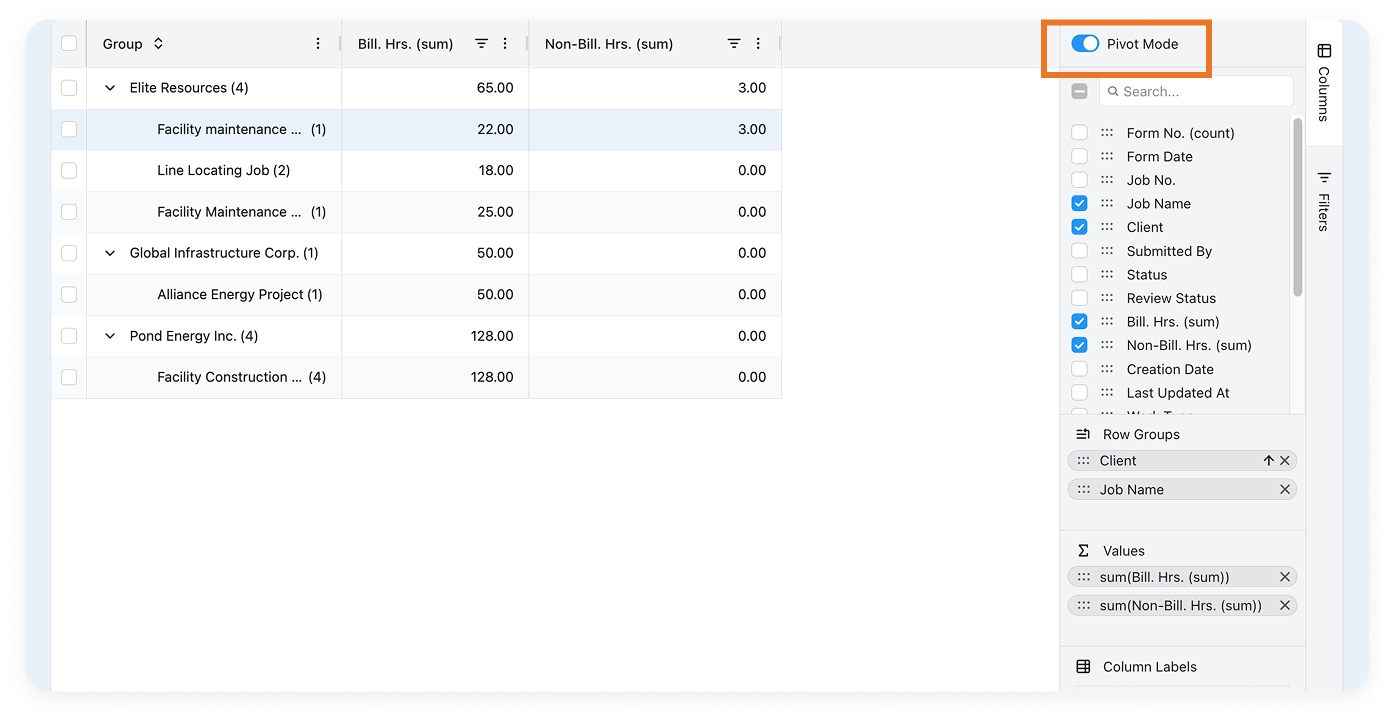
Turn on Pivot Mode, at the top of the Columns panel, to switch the table into a summary view built from your Row Groups and Values. The table then shows only your grouped fields and your totals.
For example, say you group by Client and Job Name and total Bill. Hrs. and Non-Bill. Hrs. With Pivot Mode on, the table shows three columns: one grouped column with Client and Job Name, one for Bill. Hrs., and one for Non-Bill. Hrs.
The New Report Center
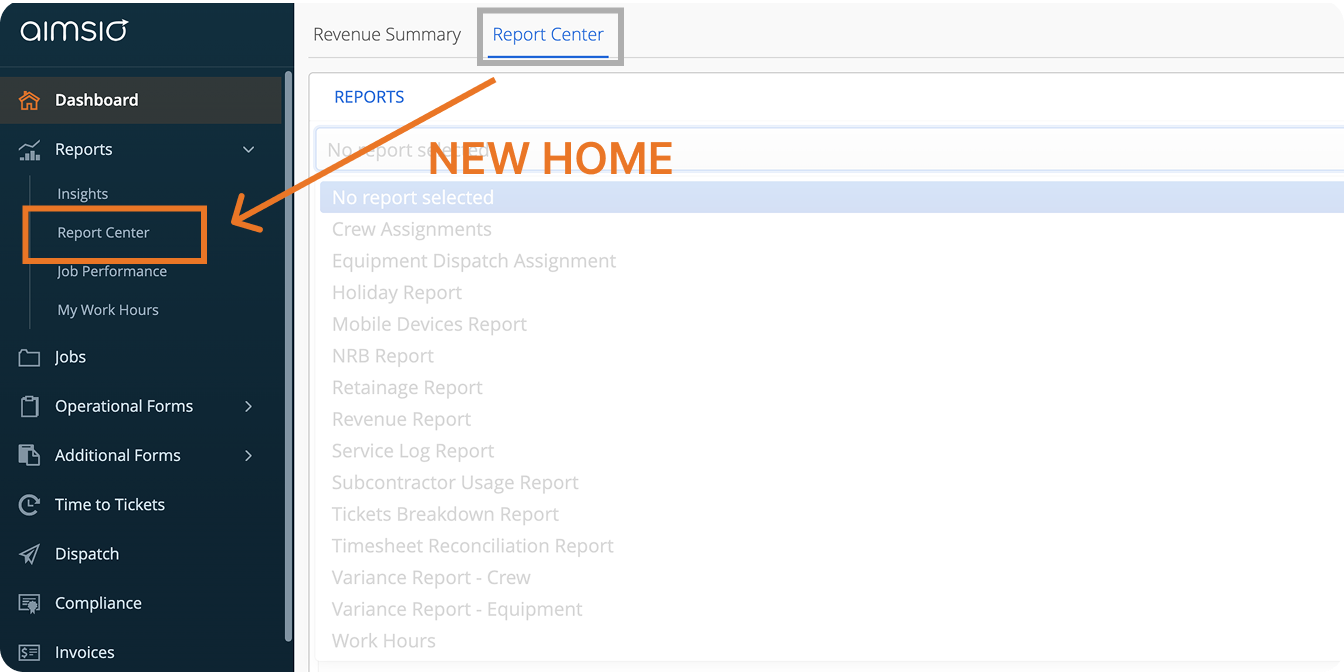
The Report Center has a new home. You’ll now find it under Reports > Report Center in the left sidebar. It was previously under the Dashboard, on the Report Center tab.
-
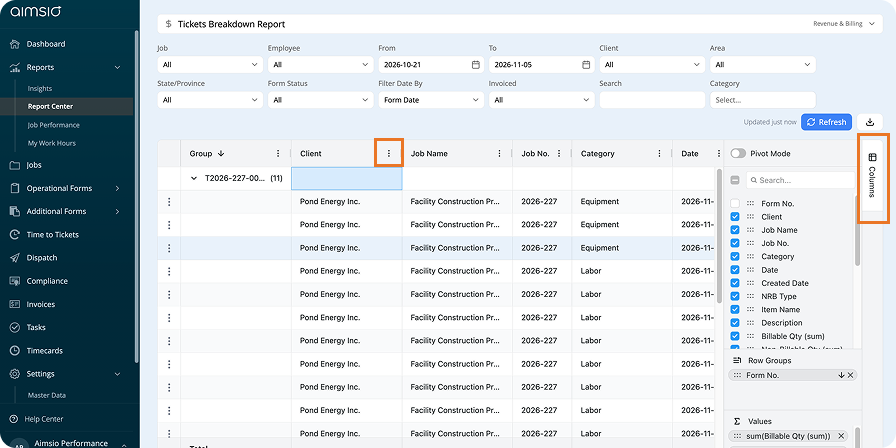
Same reports, more control. The Report Center now uses the tools you’ve just seen, including calculated columns, pivot tables, column controls, and filters.
-
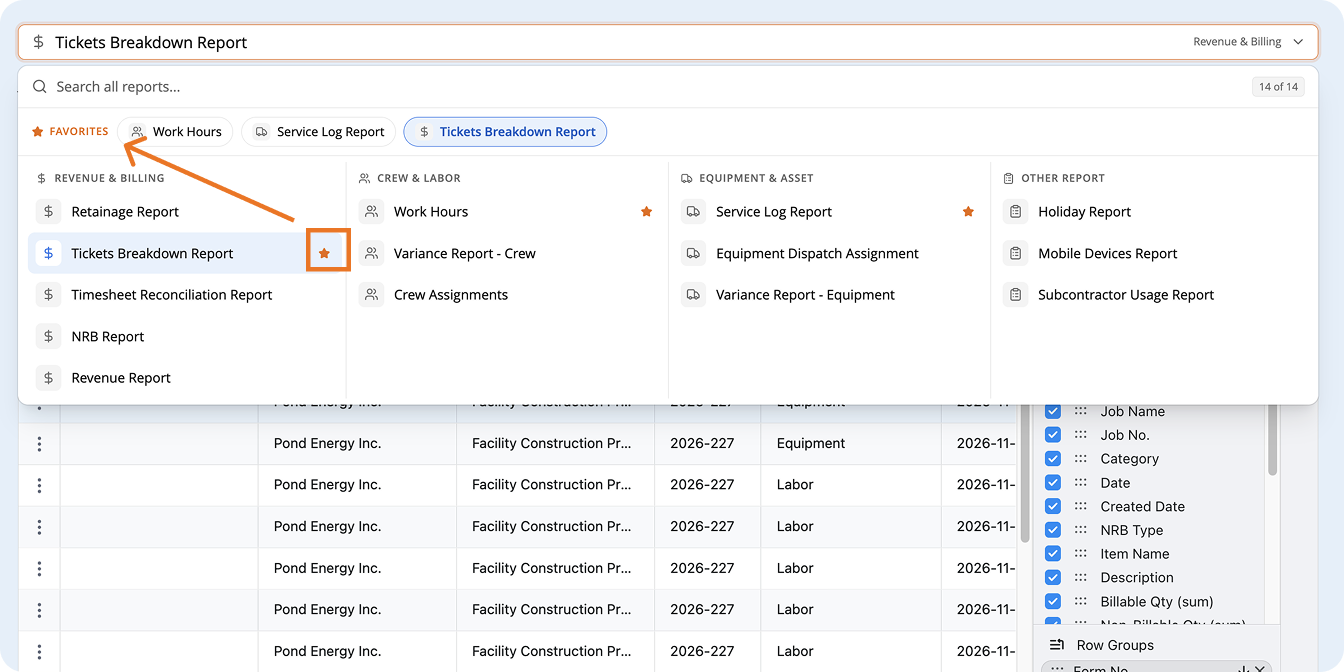
Favorite your top reports. Click the star icon next to any report. Favorites stay at the top so your most-used reports are always one click away.
-
The previous view is still available. For now, you can still open the earlier Report Center under Dashboard.
What to Expect While the Rollout Continues
-
Your data doesn’t change. Same pages, records, and approvals. What’s changing is how tables look and what you can do with them.
-
Some pages may still look different. Pages that still have the previous interface are in progress. They continue to work the way they did before, and they’ll be updated once their features are fully supported in the new interface.